Mass Migration
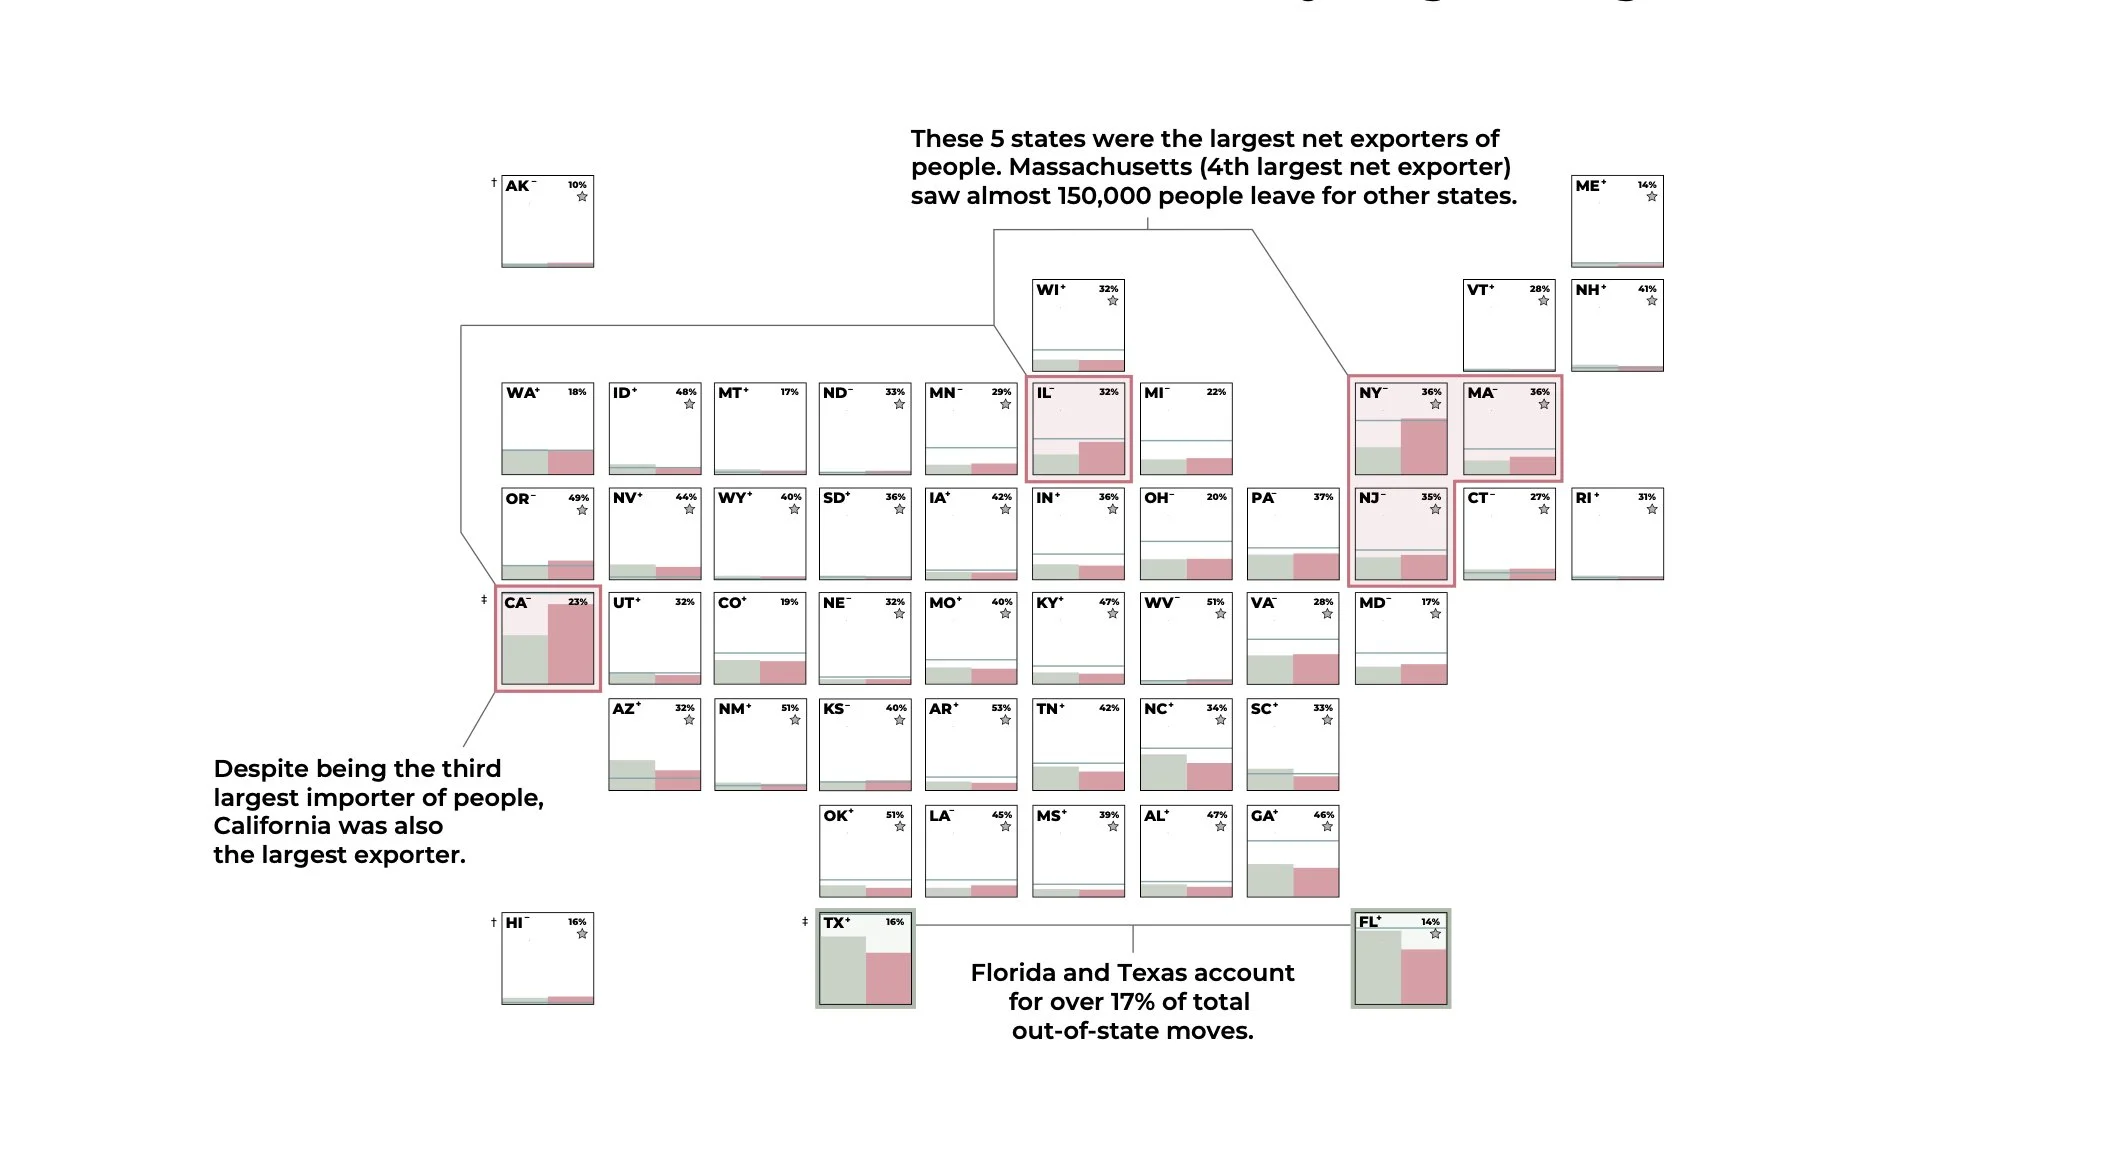
In this group project, we used data from the IRS to look at US population migration between 2019-20. We employed a funnel approach to the visualizations, looking first at how people moved at a national level, and then focussing on movement out of Massachusetts, before then looking at migration out of Suffolk County (which contains Boston).
I was responsible for the top level visual, as well as the animation. I really enjoyed the process of working with a small team and ensuring that we produced a final series of visuals that were consistent.
The final project was published as a Medium article, which can be found here.


